By Dr Andreas Procopiou
Former Senior Research Fellow in Smart Grids at the University of Melbourne and Research Engineer at the Électricité de France R&D
In public discussions about the electricity market, particularly during pre-election periods, a recurring pattern emerges. Complex technical issues are reduced to simplified narratives. The same arguments are repeated across television panels, parliamentary debates and the press, where terms such as “oligopoly,” “excess profits” and “cartels” are often presented as straightforward explanations for a fundamentally complex system.
Such characterisations are not inherently problematic. The issue arises when they are not supported by data or by an understanding of how the market actually operates.
For the first time, with the introduction of the Competitive Electricity Market, there is a complete and measurable picture of how the system functions. Data is publicly available, detailed and transparent: prices per time interval, energy volumes and generation breakdowns. This is not a marginal improvement – it is one of the most significant structural changes in the sector.
The market is no longer described through estimates or assumptions, but through measurable data. This means that analysis can be grounded in real evidence, claims can be verified, and public debate can (if it chooses to) become evidence-based.
In other words, the Competitive Market did not only introduce pricing mechanisms. It introduced transparency and accountability. Yet, much of the public discourse continues as if these data do not exist.
A key methodological error often observed is the assumption that price equals revenue. In electricity markets, economic outcomes are not determined by a single price point, but by the volume-weighted average price. That is, the price in relation to the volume of energy actually cleared.
Market data shows that during solar generation hours, the weighted average price is approximately €118/MWh for the period October 2025 to March 2026. At the same time, nearly 20 per cent of these hours clear at zero price, meaning a significant portion of energy entering the market receives no remuneration at all.
To better understand market behaviour, the following analysis of intraday price evolution shows a consistent pattern: during periods of high renewable generation, prices are significantly suppressed. Indicatively, prices drop to approximately €39 in October, €37 in November, €36 in February, and around €43 in March.
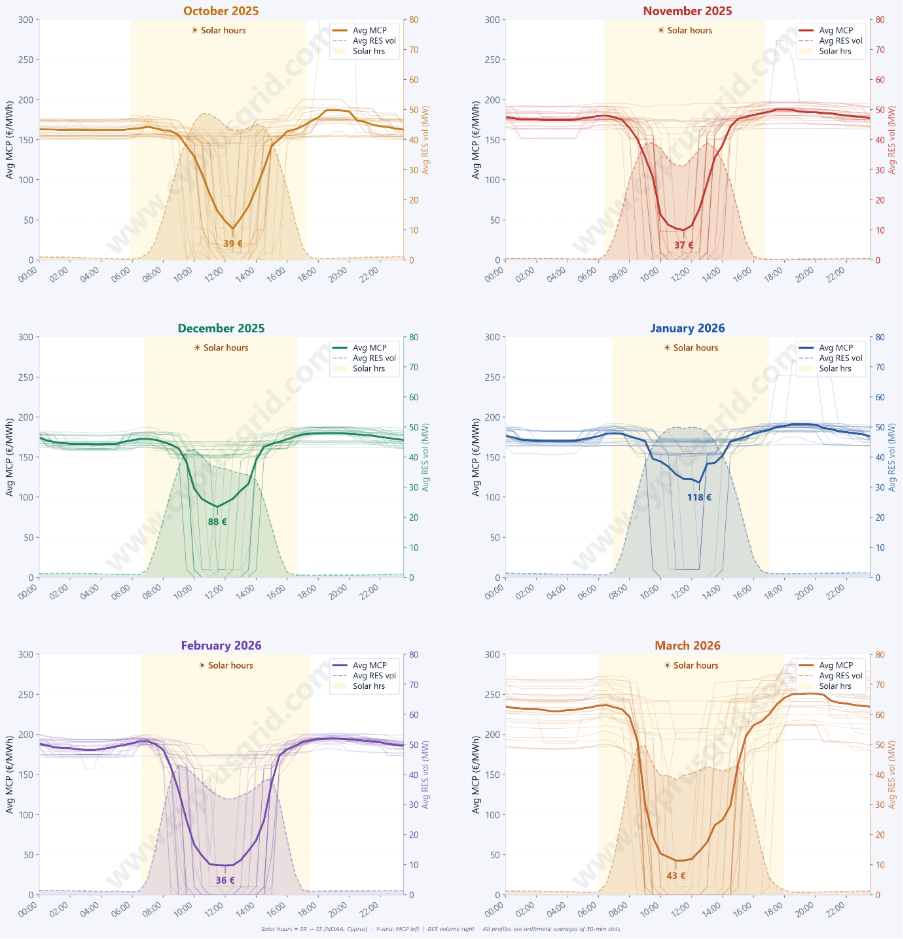
Outside these hours (when renewable generation is limited) prices return to higher levels. This demonstrates that low prices are not anomalies, but a structural outcome of high renewable penetration during solar hours.
Despite this, public discussions often focus on isolated periods of high prices, which do not represent the overall market reality.
Yes, high prices do occur , particularly when demand must be met by higher, cost conventional generation. However, the representative picture of the market emerges from the relationship between price and volume, not from isolated price spikes.
This becomes even clearer when examining price distribution. Approximately 20 per cent of energy is cleared at €0/MWh, while an additional 12 per cent is cleared between €1–€50/MWh. High-price intervals correspond to a significantly smaller share of total energy volume.
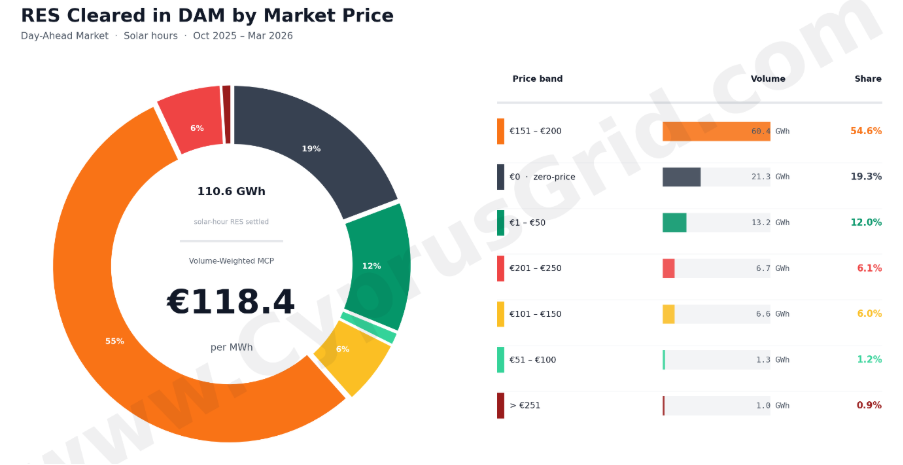
As a result, the weighted average price remains around €118/MWh, significantly lower than what might be inferred by focusing only on peak prices.
The key point is that markets are not defined by extreme prices, but by where the volume of energy is concentrated.
This can be illustrated with a simple example. If:
- 20 per cent of energy is priced at €0/MWh
- 50 per cent at €200/MWh
- 30 per cent at €100/MWh
then the actual average price is not €200/MWh, but approximately €130/MWh:
(20 per cent × €0) + (50 per cent × €200) + (30 per cent × €100) = €130/MWh
Even when high prices occur, they do not determine the overall outcome. What matters is how energy is distributed across price levels.
Another critical factor often omitted from public discussion is the volume of energy that never reaches the market.
Curtailments have become a structural feature of system operation. In many instances, curtailed energy can exceed 70 per cent of available generation, while in March, for example, curtailment levels exceeded 75 per cent. This means that a substantial volume of energy is neither cleared nor compensated.
The combined effect of low prices, zero-price intervals and high curtailment levels creates a reality that cannot be captured through selective references.
Analysing the market based on isolated price points, without considering volume and cleared energy, inevitably leads to incomplete conclusions. In a system where data is available and verifiable, more accurate and meaningful discussions are possible, provided the data is actually used.
Energy policy requires an understanding of market mechanisms and the ability to interpret data correctly. Evidence-based analysis does not limit the discussion. It improves it.
The numbers are available. The data exists. The analysis is possible.
The question is whether it is used.
In this context, the minimum expectation from those engaging in public discourse, particularly those who seek or already hold decision-making roles, is to base their positions on these data.
Otherwise, the discussion is not simply incomplete.
It is inaccurate.
And in energy policy, inaccuracy has real consequences.
The views expressed are personal.


Click here to change your cookie preferences